 |
| Captain Cook and his vessel Endeavour. |
Despite great advances in navigational aids (e.g. GPS), in many places in the world there remains great uncertainty as to exactly where dangerous reefs and shoals are in respect to a navigating vessel. Although the vessel might know (via GPS) where it is within a few metres with respect to the World Geodetic System Ellipsoid (WGS84), this is of little help if the chart on which the course is being plotted has a local offset of several hundred metres. And it doesn’t make a bit of difference if one is using an old paper chart, or a modern electronic one, because the latter is very likely based on the same old data, either way. Even worse, in remote areas there may very well be shoals and rocks that remain undiscovered, and the chart may suffer not only from a linear offset, but be distorted in some arbitrary way. This is because, even today, the foundation information for many charts of remote areas was laid by seafarers of a bygone age, when ships were driven by sail, positions were determined by sextant and chronometer and depths sounded by a lead line.
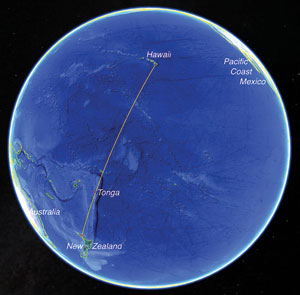 |
| Figure 1a. Where in the world is Tonga? |
It may surprise you to learn that there are parts of the world, often in remote tropical seas, where the charts have not been significantly updated or revised, only a few details amended, since the pioneering work of talented surveyors such as Captain James Cook and other explorers in the 18th Century. How is this possible? The answer lies in the considerable funding and technological capacity that are required to accurately survey an area with modern instruments, balanced against the limited resources available in remote and thinly-populated areas. The remote islands of the Ha’apai group in the Kingdom of Tonga represent one such case.
The Kingdom of Tonga is a Polynesian archipelago, scattered over 700,000 km2 of the southern Pacific Ocean. Most people have no idea where it is. If it helps, think of Tonga as being about 2/3 of the way from Hawaii to New Zealand. Still struggling to visualize it? Take a look at Fig. 1a, which gives the big picture. Talking of a big picture, did you realize that, viewed from just the right angle from space, the earth appears almost completely covered by the Pacific Ocean?
Tonga has Fiji to its west, Samoa to the northeast, Niue to the east and New Zealand far to the southwest. With only 100,000 inhabitants, spread over 170 islands strewn along a line of over 800 km, that’s a lot of ground to survey. Tonga essentially consists of three main parts; the cluster of islands of Vava’u in the north, the Ha’apai group in the middle and the largest island, Tongatapu, in the south, which hosts the kingdom’s capital, Nuku’alofa (Fig. 1b).
Tonga was nicknamed “The Friendly Islands” by Captain James Cook because of the congenial reception accorded him on his first visit in 1773. He arrived at the time of a major festival, and he and his crew were invited to the festivities. According to the chronicler William Mariner (who arrived a few years later, on a vessel whose crew were all killed, apart from him) the Tongan chiefs decided to murder Cook and his men so they could loot his ship, and the invitation to eat and drink was a ruse to take them off-guard. The plan stalled when the chiefs argued about how, when and where the ambush should be launched, so Captain Cook and his crew returned safely to their ship none the wiser. In 18th century Tonga, apparently dangerous things lay just beneath the surface, and perhaps, concerning the charts from that era, they still do.
 |
| Figure 1b. A close-up of Fig. 1a, showing the Tongan archipelago. |
Tonga lies on the Tonga-Kermadec ridge, a geologically active region formed by the collision of tectonic plates in the Southern Pacific, with a dramatic mix of coral reefs and active volcanoes, including sub-surface. Try charting a sea where brand new islands appear from time to time, such as the one that broke surface in 2015 near Hunga, between Ha’apai and Tongatapu, now some 4 km long and 100 m high. You know that your charts are of doubtful accuracy when you see two islands drawn on the chart, but three clearly visible a few miles off the starboard beam, as happened to Sailing Yacht (S/Y) Jocara this September.
And what, you might ask, was S/Y Jocara doing in Tonga, and more to the point, what has it to do with Ocean Engineering? The answer is that, curiously, in a way we have come full-circle since the days of Captain Cook and his original surveys, conducted from sailing vessels of old. Breakthroughs in charting and surveying technologies, such as airborne LIDAR and multi-beam sonar deployed from Autonomous Surface Vessels, have brought the cost of accurate high-resolution surveying of such large and complex areas into an affordable range. But LIDAR and Sonar depths must be corrected for the tides, to reduce them to a common datum (referred to as Sounding Datum) that closely correlates with the Lowest Astronomical Tide. GPS benchmarks ashore are also needed to fix this datum so that it can be recovered in future surveys, and also to allow referencing of the depths and tide heights to the WGS-84 Ellipsoid and then onto other useful land-based datums. These GPS benchmarks serve the dual purpose of increasing the density of Tonga’s national geodetic network and providing sparse high-quality control points in the most remote locations.
 |
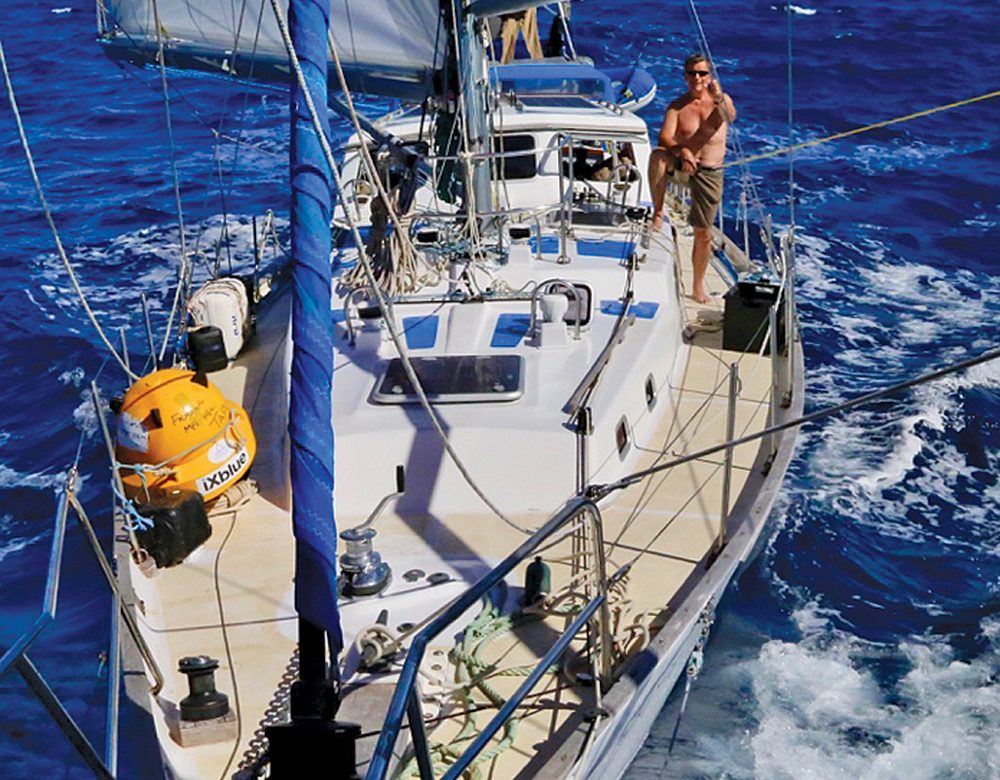
| S/Y Jocara, under sail between stations, with iXblue’s GPS buoy secured on deck. |
Enter S/Y Jocara, which the survey company iXblue chartered to support a team to establish such a GPS reference network and install tide gauges at four locations in the Ha’apai island chain and one to the south, at Eua Island. Choosing S/Y Jocara was an unconventional move. Oceanographic exploration and surveys are normally conducted from much larger, commercial motor vessels. But while a motor-driven ocean-going research vessel needs to be relatively large (to accommodate fuel and engines), typically costing tens of thousands of US Dollars per day, a blue-water sailing vessel such as S/Y Jocara can be chartered for a fraction of the cost, and yet be a perfectly good platform for lightweight exploration and ocean engineering work in remote places, e.g. installing tide gauges and landing ashore to survey GPS reference points. While relatively small (18 m in length with a 4m beam), S/Y Jocara is full-ocean capable with an autonomous endurance between refueling/resupplying spanning many weeks, if not months. S/Y Jocara is also equipped with an instrument-grade pure sine wave inverter to provide mains AC power and copious USB recharging sockets so everyone can keep their personal devices, laptops and scientific recording equipment up and running. In summary, S/Y Jocara offers a cost-competitive solution to small expeditionary survey teams who need access to remote islands, even for extended periods. Finally, it just so happens that S/Y Jocara is owned and operated by Dr. John Potter, an IEEE Fellow and a member of the OES AdCom, who has spent the better part of 2018 working alongside his son, Casper, in New Zealand refitting S/Y Jocara in preparation for supporting just this kind of remote surveying and research effort.
 |
| The survey team hard at work, setting up a GPS receiver. |
On this occasion, a 4-man surveying team was formed by iXblue under a contract from Land Information New Zealand (LINZ) funded by the Ministry of Foreign Affairs and Trade (MFAT) under the Pacific Regional Navigation Initiative (PRNI). The PRNI has NZ$7.2m to invest over a 6-year programme to improve maritime safety, including hydrographic charts, in the Pacific. Their focus is on the countries for which New Zealand is the Primary Charting Authority (Tonga, Tokelau, Niue, Samoa and the Cook Islands). Obviously, it is not possible to survey every part of such a vast area, nor is it possible to detect and accurately describe every hazard, and inevitably some will remain uncharted. Nevertheless, the PRNI works in close partnership with LINZ and the Pacific Community (SPC), with the aim to enable countries to establish points of contact who can coordinate Maritime Safety Information, forming a key link in getting Notices to Mariners (warning of hazards) communicated effectively. As part of this effort, nautical charts are being updated and converted to Electronic Navigation Charts following high-resolution hydrographic surveys. These new charts will empower compliance with international maritime regulations and provide for safer maritime transport, in addition to facilitating increased tourism by a variety of smaller sail and motor vessels. PRNI is also delivering capacity building and training to Pacific island officials, one of whom was on board S/Y Jocara as part of the survey team.
Jocara began her charter in North Island, New Zealand, by taking on board 400 kg of equipment for the expedition, which she then ferried up to Nuku’alofa, the capital of Tonga, in a 7-day ocean transit of 1,100 n.m. The survey team then flew in and joined Jocara in Nuku’alofa, from where she headed out to the island of Eua to establish the first station. Each station required Jocara to stand by for 2-3 days while three GPS receivers, accurately positioned directly over the installed GPS benchmarks, collected sufficient data to establish, via post-processing, a GPS reference point and for the tide gauges to get a preliminary estimate of tidal components and phases. Then the team would recover the GPS receivers, re-deploy the tide gauges to collect a longer-term record, and we’d move on to the next site. Each site might typically be separated by 30-60 n.m. from its nearest neighbours, with the five sites distributed through the Tongan archipelago so as to provide the best network coverage.
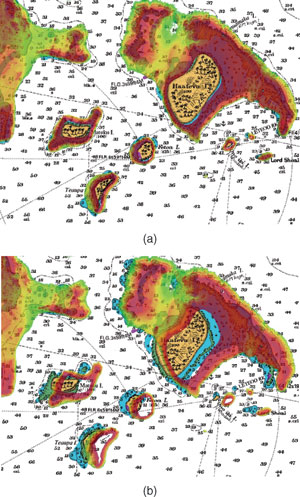 |
| Figure 2. Preliminary LIDAR bathymetry (not to be used for navigation) (a) superimposed on an existing chart that has had a 350 m corrective offset applied, (b) superimposed on an existing chart, with no offset correction. |
Fig. 2a shows a preliminary result (not to be used for navigation), overlaying LIDAR bathymetric data (shown as a colour scale) onto an existing chart. The colour is intuitively graded from purple (very shallow) through red, orange, yellow and green (deeper). LIDAR is most useful in providing bathymetric coverage over inshore areas, which may not be deep enough for a vessel to safely navigate. At depths greater than 20-40 m (depending on water clarity) the shallow-water LIDAR system employed (a Leica Chiroptera 4X) becomes increasingly less able to detect the reflected laser beam from the seabed, and eventually cannot determine the depth. This is where iXblue’s Autonomous Surface Vessel, with its multi-beam sonar, takes over. So the colour depths overlaid in Fig. 2a only extend to intermediate depth water, the deepest areas remaining white as the LIDAR data overlay becomes transparent. The example in Fig. 2a shows the island of Ha’afeva, in the central region of the Ha’apai, with numerous smaller islets scattered to the south and west, and an extensive reef to the west.
At first glance, the LIDAR bathymetry seems to agree remarkably well with the older chart, whose depths are marked in fathoms. The shape of the islands, and of the shallow-water bathymetric contours, are in close agreement. It seems that Capt. Cook did a pretty good job, with his limited technology. And so he did, at least in describing the general shape and arrangement of the islands and reefs.
The most startling, and alarming, feature of this overlay is that, in order to align the LIDAR bathymetry up with the chart, a 350 m offset had to be applied to the chart. That is, the current chart has a local positional error of some 350 m. The equivalent overlay, but without the 350 m chart offset, is shown in Fig. 2b.
If a vessel is negotiating a narrow pass into an anchorage, Fig. 2b shows that this can make the difference between being squarely in the middle of the channel, and being wrecked on a reef. It is this chart offset, reflecting the difficulty of precise positioning in Latitude and Longitude in the days of Captain Cook, that makes an apparently detailed and mostly accurate chart an invitation to disaster, if the local chart offset is unknown. This is enough to deter unfamiliar mariners and pose a real threat to vessels venturing into the area without local knowledge. It is thus vital, but often poorly-understood, that the local offset, if any, is carefully estimated before entrusting the navigation of a vessel to GPS.
Even so, this ‘offset’ is only a local linear approximation to a more complex distortion of the chart’s features, so needs to be determined separately for different areas covered by the chart. Jocara routinely estimates the local chart offset by aligning radar returns from islands, and breakers over reefs, with the electronic chart. We are fortunate to be able to directly overlay radar returns onto the electronic chart on the 12” colour screen of our electronic navigation system. By applying East-West and North-South shifts, and perhaps also a rotation, radar features and expected returns from elements shown on the chart can often be reconciled and the differences minimized to provide a good estimate of the local chart offset. Jocara can then proceed with caution, and always with a sharp lookout for the changing colours of shallow water. Even so, it has happened more than once that a lookout on the bowsprit has seen a coral head appear out of nowhere, directly ahead, the coral polyps clearly visible, only to slip harmlessly beneath the keel a few seconds later, while the helmsman in the cockpit believes himself to be in deep water with no dangers indicated for miles.
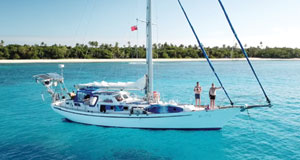 |
| S/Y Jocara at anchor at one of the stations in Ha’apai. |
The westernmost site we were called on to survey was on the extinct volcanic island of Tofua, with its towering steep-sided cliffs guarding its entire shoreline. Captain Bligh certainly found Tofua inhospitable, having been cast adrift by Fletcher Christian with nothing more than a few rations, plus a quadrant and compass to navigate by (no charts or chronometer). Bligh (who had served under Captain Cook) stopped at Tofua, but one of his men was killed by the locals, so he ended up sailing another 3,500 n.m. west to reach Timor in Indonesia, regarded to this day as one of the most accomplished feats of open water navigation.
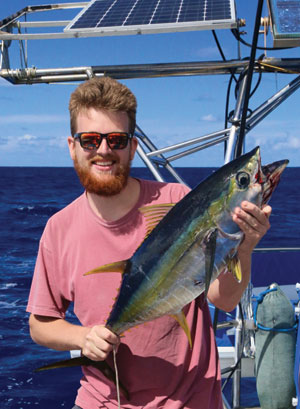 |
| A fine young yellowfin tuna—sashimi and sushi on the menu tonight! |
At each station, our local surveyor, from the Ministry of Lands and Natural Resources, was of invaluable help in providing liaison, often being called upon to explain why these odd characters with their yellow tripods and brightly-coloured safety gear, carrying strange equipment, should be left alone to drill into rocks and concrete jetties, cementing in their GPS reference marks. Sometimes its hard to explain to a hard-working man, laboring under the weight of a pig or two, that it is so important not only to not bump into, but not even to touch, a sensitive tripod with its GPS receiver, surveyed to an accuracy of millimeters rather than metres.
As our work drew to a close, Jocara sailed back south to Nuku’alofa, revisiting some of the sites along the way to check on the tide gauges, and eventually discharged her survey team back on to dry land for their flights home. The team, having previously been accustomed to working on grimy workboats smelling of diesel, left with a new experience of surveying from a compact, wind-powered alternative surveying support vessel, finding it a novel but very pleasant alternative. The food wasn’t too bad either, often supplemented by the fresh catch of the day, including sashimi and sushi (Jocara is furnished with Japanese rice wine, sushi nori dried seaweed sheets, the best wasabi and soy sauce and bamboo mats to roll the sushi in).
iXblue are now engaged in conducting the multi-beam sonar part of the work, using their in-house designed 8 m Autonomous Surface Vessel, supported by a larger (but much more expensive) motor vessel. Once all the data is in, and the data analysis complete, we can all look forward to seeing the first genuinely new charts of the Ha’apai island chain, with unprecedented accuracy and resolution, courtesy of iXblue, LINZ, MFAT and PRNI. But lest we be tempted to rest on our laurels, there’s a lot more to do, as Fig. 1a illustrates!
Plans are to continue to use S/Y Jocara for expeditions, research, adventure and eco-tourism anywhere in the world, given the time and water under her keel to get there.
https://www.facebook.com/JocaraOceanExpeditions http://www.jocara.net.
 Suleman Mazhar has been working as a professor in Information & Communication Engineering at Harbin Engineering University (China) since July 2019. He did PhD from Tokyo University (Japan) and postdoctorate from Georgetown University (Washington DC, USA). He had BS-CS from FAST-NUCES (Lahore) and MS from GIK Institute (Pakistan). He is TYSP young scientist fellow (Ministry of Science & Technology China) and have won several research grants from international organizations such as DAAD (Germany), ICIMOD (Nepal), NRPU (Higher Education Commission Pakistan), WWF (Worldwide Fund for Nature) Pakistan. His research focus is deep learning and signal processing applications for environmental monitoring, with particular focus on underwater acoustics, and marine mammal conservation. He is a reviewer for professional journals such as Journal of Acoustical Society (America), IEEE Journal of Oceanic Engineering, IEEE Sensors Journal, Applied Acoustics, IEEE Transactions on Intelligent Transportation Systems.
 Peng Ren is a full professor with the College of Oceanography and Space Informatics, China University of Petroleum (East China). He is the director of Qingdao International Research Center for Intelligent Forecast and Detection of Oceanic Catastrophes. He received the K. M. Scott Prize from the University of York, the Natural Science award (first rank) from China Institute of Electronics, and the Eduardo Caianiello Best Student Paper Award from 18th International Conference on Image Analysis and Processing as one co-author. He has served as an associate editor of IEEE Transactions on Geoscience and Remote Sensing.
 Mohd Rizal Arshad is a full professor at the School of Electrical and Electronic Engineering at Universiti Sains Malaysia (USM), Malaysia, where he specializes in ocean robotics technology and intelligent system. He received his B.Eng. in Medical Electronics & Instrumentation and PhD in Electronic Engineering from University of Liverpool, UK in 1994 and 1999, respectively. He completed his MSc. in Electronic Control Engineering from the University of Salford, UK in Dec 1995. He has supervised many postgraduate students and published extensively in local and international publications. He is a senior member of the IEEE, and was awarded IEEE OES Presidential Award in 2019.
 Itzik Klein is an Assistant Professor, heading the Autonomous Navigation and Sensor Fusion Lab, at the Charney School of Marine Sciences, Hatter Department of Marine Technologies, University of Haifa. He is an IEEE Senior Member and a member of the IEEE Journal of Indoor and Seamless Positioning and Navigation (J-ISPIN) Editorial Board. Prior to joining the University of Haifa, he worked at leading companies in Israel on navigation topics for more than 15 years. He has a wide range of experience in navigation systems and sensor fusion from both industry and academic perspectives. His research interests lie in the intersection of artificial intelligence with inertial sensing, sensor fusion, and autonomous underwater vehicles.
 John R. Potter (IEEE M’94, SM’02, F’18) graduated in the previous century with a joint honours Mathematics and Physics Degree from Bristol and a PhD. in Glaciology and Oceanography from Cambridge, UK studying Antarctic ice mass balance, where he spent four consecutive summers. This work helped underscore the non-linear fragility of polar ice to climate change and led to him receiving the Polar Medal from Queen Elizabeth II in 1988.
 Nick is a Visiting Fellow at the UK National Oceanographic Center, Southampton His nomination was endorsed by the Underwater Acoustics Technology Committee. He had worked as a Research Associate and Lecturer at University of Birmingham and has been working as a Research Scientist at the Applied Research Laboratory, University of Texas, Austin. He has also served as a Program Officer at the Office of Naval Research Global. He is a senior member of IEEE (OES) and a Fellow of Acoustical Society of America (ASA). Nick has also been serving as Assoc. Editor for IEEE JoE and JASA. He is widely acknowledged for his expertise are seabed acoustics, parametric array modeling, sonar beamformer, underwater signal processing.
 Maurizio Migliaccio (M’91-SM’00-F’17) is Full professor of Electromagnetics at Università di Napoli Parthenope (Italy) and was Affiliated Full Professor at NOVA Southeastern University, Fort Lauderdale, FL (USA). He has been teaching Microwave Remote Sensing since 1994. He was visiting scientist at Deutsche Forschungsanstalt fur Lüft und Raumfahrt (DLR), Oberpfaffenhofen, Germany. He was member of the Italian Space Agency (ASI) scientific committee. He was member of the ASI CosmoSkyMed second generation panel. He was e-geos AdCom member. He was Italian delegate of the ESA PB-EO board. He was Member of South Africa Expert Review Panel for Space Exploration. He serves as reviewer for the UE, Italian Research Ministry (MIUR), NCST, Kazakhstan and Hong Kong Research board. He lectured in USA, Canada, Brazil, China, Hong Kong, Germany, Spain, Czech Republic, Switzerland and Italy. He was Italian delegate at UE COST SMOS Mode Action. He is listed in the Italian Top Scientists. He is an IEEE Trans. Geoscience and Remote Sensing AE, International Journal of Remote Sensing AE, and was IEEE Journal of Oceanic Engineering AE Special Issue on Radar for Marine and Maritime Remote Sensing, IEEE JSTARS AE of the Special Issue on CosmoSKyMed, Member of the Indian Journal of Radio & Space Physics Editorial board. His main current scientific interests cover SAR sea oil slick and man-made target monitoring, remote sensing for marine and coastal applications, remote sensing for agriculture monitoring, polarimetry, inverse problems for resolution enhancement, reverberating chambers. He published about 160 peer-reviewed journal papers on remote sensing and applied electromagnetics.
 He has developed various types of Autonomous Underwater Vehicles (AUVs) and related application technologies including navigation methods, a new sensing method using a chemical sensor, precise seafloor mapping methods, a precise seabed positioning system with a resolution of a few centimeters, a new sensing system of the thickness of cobalt-rich crust; and more. He has shown, by using these technologies that AUVs are practicable and valuable tools for deep-sea exploration.
 Donna Kocak has had an outstanding career in defense and scientific projects developing and applying solutions in subsea optics, imaging and robotics. She graduated with an M.Sc in Computer Science in 1997 from the University of Central Florida; an MBA in 2008 from the University of Florida; and M.Sc in Industrial Engineering in 2011 from the University of Central Florida. She is currently a Senior Scientist, Advanced Concepts Engineering, and Fellow at the Harris Corporation in Melbourne, Florida, where she has developed novel optical imaging and communication solutions for under-sea defense and scientific projects. Prior to 2008 Donna Kocak was Founder and President of Green Sky Imaging, LLC (GSI) who developed laser/video photogrammetry software for underwater inspection and survey. Her earlier career positions were with Naval Training Systems Center, Florida; Harbor Branch Oceanographic Institution, Florida; eMerge Interactive; and the Advanced Technologies Group in Florida.
 John Potter has a Joint Honours degree in Mathematics and Physics from Bristol University in the UK and a PhD in Glaciology and Oceanography from the University of Cambridge on research in the Antarctic, for which he was awarded the Polar Medal in 1988. John has worked on polar oceanography, underwater acoustics, ambient noise (including imaging), marine mammals, communications, IoUT, autonomous vehicles and strategic development. He has 40 years’ international experience working at the British Antarctic Survey in the UK, NATO in Italy, SIO in California, NUS in Singapore and most recently at NTNU in Norway. John is a Fellow of the IEEE and MTS, an Associate Editor for the IEEE Journal of Oceanic Engineering, IEEE OES Distinguished Lecturer, PADI Master Scuba Diver Trainer & an International Fellow of the Explorer’s Club.
 Dr. James V. Candy is the Chief Scientist for Engineering and former Director of the Center for Advanced Signal & Image Sciences at the University of California, Lawrence Livermore National Laboratory. Dr. Candy received a commission in the USAF in 1967 and was a Systems Engineer/Test Director from 1967 to 1971. He has been a Researcher at the Lawrence Livermore National Laboratory since 1976 holding various positions including that of Project Engineer for Signal Processing and Thrust Area Leader for Signal and Control Engineering. Educationally, he received his B.S.E.E. degree from the University of Cincinnati and his M.S.E. and Ph.D. degrees in Electrical Engineering from the University of Florida, Gainesville. He is a registered Control System Engineer in the state of California. He has been an Adjunct Professor at San Francisco State University, University of Santa Clara, and UC Berkeley, Extension teaching graduate courses in signal and image processing. He is an Adjunct Full-Professor at the University of California, Santa Barbara. Dr. Candy is a Fellow of the IEEE and a Fellow of the Acoustical Society of America (ASA) and elected as a Life Member (Fellow) at the University of Cambridge (Clare Hall College). He is a member of Eta Kappa Nu and Phi Kappa Phi honorary societies. He was elected as a Distinguished Alumnus by the University of Cincinnati. Dr. Candy received the IEEE Distinguished Technical Achievement Award for the “development of model-based signal processing in ocean acoustics.” Dr. Candy was selected as a IEEE Distinguished Lecturer for oceanic signal processing as well as presenting an IEEE tutorial on advanced signal processing available through their video website courses. He was nominated for the prestigious Edward Teller Fellowship at Lawrence Livermore National Laboratory. Dr. Candy was awarded the Interdisciplinary Helmholtz-Rayleigh Silver Medal in Signal Processing/Underwater Acoustics by the Acoustical Society of America for his technical contributions. He has published over 225 journal articles, book chapters, and technical reports as well as written three texts in signal processing, “Signal Processing: the Model-Based Approach,” (McGraw-Hill, 1986), “Signal Processing: the Modern Approach,” (McGraw-Hill, 1988), “Model-Based Signal Processing,” (Wiley/IEEE Press, 2006) and “Bayesian Signal Processing: Classical, Modern and Particle Filtering” (Wiley/IEEE Press, 2009). He was the General Chairman of the inaugural 2006 IEEE Nonlinear Statistical Signal Processing Workshop held at the Corpus Christi College, University of Cambridge. He has presented a variety of short courses and tutorials sponsored by the IEEE and ASA in Applied Signal Processing, Spectral Estimation, Advanced Digital Signal Processing, Applied Model-Based Signal Processing, Applied Acoustical Signal Processing, Model-Based Ocean Acoustic Signal Processing and Bayesian Signal Processing for IEEE Oceanic Engineering Society/ASA. He has also presented short courses in Applied Model-Based Signal Processing for the SPIE Optical Society. He is currently the IEEE Chair of the Technical Committee on “Sonar Signal and Image Processing” and was the Chair of the ASA Technical Committee on “Signal Processing in Acoustics” as well as being an Associate Editor for Signal Processing of ASA (on-line JASAXL). He was recently nominated for the Vice Presidency of the ASA and elected as a member of the Administrative Committee of IEEE OES. His research interests include Bayesian estimation, identification, spatial estimation, signal and image processing, array signal processing, nonlinear signal processing, tomography, sonar/radar processing and biomedical applications.
 Kenneth Foote is a Senior Scientist at the Woods Hole Oceanographic Institution. He received a B.S. in Electrical Engineering from The George Washington University in 1968, and a Ph.D. in Physics from Brown University in 1973. He was an engineer at Raytheon Company, 1968-1974; postdoctoral scholar at Loughborough University of Technology, 1974-1975; research fellow and substitute lecturer at the University of Bergen, 1975-1981. He began working at the Institute of Marine Research, Bergen, in 1979; joined the Woods Hole Oceanographic Institution in 1999. His general area of expertise is in underwater sound scattering, with applications to the quantification of fish, other aquatic organisms, and physical scatterers in the water column and on the seafloor. In developing and transitioning acoustic methods and instruments to operations at sea, he has worked from 77°N to 55°S.
 René Garello, professor at Télécom Bretagne, Fellow IEEE, co-leader of the TOMS (Traitements, Observations et Méthodes Statistiques) research team, in Pôle CID of the UMR CNRS 3192 Lab-STICC.
 Professor Mal Heron is Adjunct Professor in the Marine Geophysical Laboratory at James Cook University in Townsville, Australia, and is CEO of Portmap Remote Ocean Sensing Pty Ltd. His PhD work in Auckland, New Zealand, was on radio-wave probing of the ionosphere, and that is reflected in his early ionospheric papers. He changed research fields to the scattering of HF radio waves from the ocean surface during the 1980s. Through the 1990s his research has broadened into oceanographic phenomena which can be studied by remote sensing, including HF radar and salinity mapping from airborne microwave radiometers . Throughout, there have been one-off papers where he has been involved in solving a problem in a cognate area like medical physics, and paleobiogeography. Occasionally, he has diverted into side-tracks like a burst of papers on the effect of bushfires on radio communications. His present project of the Australian Coastal Ocean Radar Network (ACORN) is about the development of new processing methods and applications of HF radar data to address oceanography problems. He is currently promoting the use of high resolution VHF ocean radars, based on the PortMap high resolution radar.
 Hanu Singh graduated B.S. ECE and Computer Science (1989) from George Mason University and Ph.D. (1995) from MIT/Woods Hole.He led the development and commercialization of the Seabed AUV, nine of which are in operation at other universities and government laboratories around the world. He was technical lead for development and operations for Polar AUVs (Jaguar and Puma) and towed vehicles(Camper and Seasled), and the development and commercialization of the Jetyak ASVs, 18 of which are currently in use. He was involved in the development of UAS for polar and oceanographic applications, and high resolution multi-sensor acoustic and optical mapping with underwater vehicles on over 55 oceanographic cruises in support of physical oceanography, marine archaeology, biology, fisheries, coral reef studies, geology and geophysics and sea-ice studies. He is an accomplished Research Student advisor and has made strong collaborations across the US (including at MIT, SIO, Stanford, Columbia LDEO) and internationally including in the UK, Australia, Canada, Korea, Taiwan, China, Japan, India, Sweden and Norway. Hanu Singh is currently Chair of the IEEE Ocean Engineering Technology Committee on Autonomous Marine Systems with responsibilities that include organizing the biennial IEEE AUV Conference, 2008 onwards. Associate Editor, IEEE Journal of Oceanic Engineering, 2007-2011. Associate editor, Journal of Field Robotics 2012 onwards.
 Milica Stojanovic graduated from the University of Belgrade, Serbia, in 1988, and received the M.S. and Ph.D. degrees in electrical engineering from Northeastern University in Boston, in 1991 and 1993. She was a Principal Scientist at the Massachusetts Institute of Technology, and in 2008 joined Northeastern University, where she is currently a Professor of electrical and computer engineering. She is also a Guest Investigator at the Woods Hole Oceanographic Institution. Milica’s research interests include digital communications theory, statistical signal processing and wireless networks, and their applications to underwater acoustic systems. She has made pioneering contributions to underwater acoustic communications, and her work has been widely cited. She is a Fellow of the IEEE, and serves as an Associate Editor for its Journal of Oceanic Engineering (and in the past for Transactions on Signal Processing and Transactions on Vehicular Technology). She also serves on the Advisory Board of the IEEE Communication Letters, and chairs the IEEE Ocean Engineering Society’s Technical Committee for Underwater Communication, Navigation and Positioning. Milica is the recipient of the 2015 IEEE/OES Distinguished Technical Achievement Award.
 Dr. Paul C. Hines was born and raised in Glace Bay, Cape Breton. From 1977-1981 he attended Dalhousie University, Halifax, Nova Scotia, graduating with a B.Sc. (Hon) in Engineering-Physics.